- Fixed/ Flexible Exchange Rates
- Flexible/Floating- based on supply and demand of currency
- Very sensitive to business cycle
- Provide options for investments
- Fixed Rate- based on country’s willingness to distribute currency and to control the amounts
- If market appreciates, eports go down, AD/GDP decrease
- If market depreciates, exports go up AD/GDP increase
- Absolute Advantage (Video explaining the difference between absolute and comparative advantage)
- Individual- exists when a person can produce more of a certain good/service than someone else in the same amount of time (or can produce a good using the least amount of resources)
- National- Exists when a country can produce more of a good/service than another country can in the same period
- Comparative Advantage
- A person or a nation has a comparative advantage in the production of a product when it can produce the product at a lower domestic opportunity cost than can a trading partner
- Ex. output Tons per acre, mph, wpm,
- Input: Hours to do job, acres to feed, number of gallons to paint
- Specialization and trade
- Gains from trade are based on comparative advantage, not absolute
Thursday, May 12, 2016
Unit 7; Day 4

Unit 7; Day 3
- Foreign Exchange Market
- The buying and selling of currency
- Ex. In order to purchase souvenirs in France, it is first necessary for americans to sell their dollars and buy Euros
- Transaction that occurs in the balance of payments necessitate foreign exchange.
- Changes in Exchange Rates
- An increase in the supply of currency will decrease the exchange rate of a currency
- A decrease in supply of a currency will increase exchange rate
- Increase in demand for a currency increases exchange rate
- Decrease in demand for currency will decrease exchange rate
- Appreciation and Depreciation
- Appreciation of a currency occurs when exchange rate increases
- Deprecation currency occurs when exchange rate decreases
- Ex. Germans go to america, Supply of euros increase, demand for dollars increase. Euro depreciates, Dollar appreciates
- Exchange Rate Determinants
- Consumer tastes
- Ex. Preference for jap. Goods creates increase in S of dollars, depreciation of dollar
- Relative Income
- Relative Price Level
- Speculation
- Exports and Imports
- The exchange rate is a determinant of both exports and imports
- Appreciation of the dollar causes American goods to be relatively more expensive and foreign goods to be cheaper thus reducing exports and increasing imports
- Depreciation of the dollar causes American goods to be relatively cheaper and foreign goods to be relatively more expensive thus increasing exports and reducing imports


As the demand for a foreign currency increases, the supply of US currency increases to match the conversion. This results in a depreciation of the dollar(aka lower price levels) and an appreciation of foreign currency(increased prices for foreign currency)
Unit 7; Day 2
Relationship Between Current and Capital Account (Quick video summarizing the relationship)
- Current account and Capital Account should zero out
- If current account has negative balance(deficit), then capital account should then have a positive balance(Surplus)
- Official Reserves
- The foreign currency holdings of the US Federal Reserve System
- When there is a balance of payments surplus, the Fed accumulates foreign currency and debits the balance of payments
- When there is a balance of payments deficit, the fed depletes its reserves of foreign currency and credits balance of payments
- The Official reserves zeros out the balance of payments
- Active v. Passive Official Reserves
- The US is passive in its use of official Reserves. It does not seek to manipulate the dollar exchange
Unit 7; Day 1
- Balance of Payments
- Measure of money inflows and outflows between US and Rest of World(ROW)
- Inflows= CREDITS
- Outflows= DEBITS
- Balance of payments divided into 3 accounts
- Capital Account/Financial Account
- Official Reserves Account
- Current Account
- Current Account (Current Accounts Video)
- Balance of trade or Net Exports
- Exports of goods/services
- Import of good/services
- Exports create a credit to balance of payments
- Imports create a debit to the balance of payments
- Net Foreign Income
- Income earned by US owned foreign assets- Income paid to foreign held US assets
- Ex. Interest payments on US owned brazilian bonds- interest payments on german owned US bonds
- Net Transfers (Tend to be unilateral)
- Foreign Aid> A debit to current account
- Ex. Mexican migrant workers send money to family in mexico
- Capital/ Financial Account (Capital Accounts Video)
- Balance of Capital Ownership
- Includes purchase of both real and financial assets
- Direct Investment in US is credit to capital account
- Ex. Toyota Factory in San Antonio
- Direct Investment By US firms/ Individuals in a Foreign country are debits to capital account
- Intel Factory in San Jose, Costa Rica
- Purchase of foreign financial Assets represent Debit to Capital Account
- Ex. Warren Buffett buys stock in Petrochina
- Purchase of Domestic Financial Assets by foreigners represent Credit to capital Account
- UAE Fund purchases a large stake in NASDAQ
Unit 6; Day 2
- Hindrances to Growth
- Economic and Political Instability
- High inflationary expectations
- Absence of the rule of law
- Diminished Private Property Rights
- Negative Incentives
- The welfare state
- Lack of Savings
- Excess current consumption
- Failure to maintain existing capital
- Crowding Out of Investment
- Government deficits & debt increasing long term interest rates!
- Increased income inequality → Populist policies
- Restrictions on Free International Trade
- Technology and Productivity
- Research and development, innovation and invention yield increases in available technology.
- More technology in the hands of workers increases productivity.
- Productivity is output per worker.
- More Productivity = Economic Growth.
Unit 6; Day 1
- Economic Growth
- sustained increase in real GDP over time
- Sustained increase in Real GDP per Capita over time

- Why grow?
- Growing leads to greater prosperity for society
- Lessens the burden of scarcity.
- Increases the general level of well-being
- Conditions for Growth
- Rule of Law
- Sound Legal and Economic Institutions
- Economic Freedom
- Respect for Private Property
- Political & Economic Stability
- Low Inflationary Expectations
- Willingness to sacrifice current consumption in order to grow
- Saving
- Trade
- Types of Capital
- Physical:
- Tools, machinery, factories, infrastructure
- Physical Capital is the product of Investment.
- Investment is sensitive to interest rates and expected rates of return.
- It takes capital to make capital.
- Capital must be maintained.
- Human
- People are a country’s most important resource. Therefore human capital must be developed.
- Education
- Economic Freedom
- The right to acquire private property
- Incentives
- Clean Water
- Stable Food Supply
- Access to technology
Wednesday, May 11, 2016
Unit 5; Day 3
- Supply Side economics( Reaganomics) (Reaganomics quick summary Video)
- Change in AD but not in AS
- Determines- rate of inflation, unemployment rates and economic growth
- Supply Side economists support policies that promote GDP growth by arguing that high marginal tax rates along with the current system of transfer payments provide disincentive to work, invest, innovate and… entrepreneurial ventures.
- Lower Marginal tax rates induce more work which cause AS to increase and also make work more attractive
- Incentive to save and invest:
- Higher Marginal tax rates reduce rewards for savings and investment
- Consumption might increase but investment depends upon savings
- Lower marginal tax rates encourage savings and investment
- Laffer curve- theoretical relationship between tax rates and govt revenue
- As tax rates increase from zero, govt revenue increase from zero to some maximum level and then decline
- Research suggests that impact of tax rates on incentives to work, save and invest is small
- Tax cuts also increase demand which fuels inflation and causes demand to exceed supply
- Where the economy is actually located on the curve is difficult to determine

Unit 5; Day 2
The Phillips Curve
- Long Run Phillips Curve
- Natural rate of unemployment is constant |
- Because the LRPC exists at natural rate of unemployment(Un), structural changes in the economy that affect Un will also cause LRPC to shift
- Increases in Un will shift LRPC >
- Decreases will shift LRPC <
- Short Run Phillips Curve
- Tradeoff between inflation and unemployment
- When one increase, the other decrease
- Inflation increases as economy expands
- Recession- unemployment increases as ecnomy slows (contracts)
- Along the curve- Cyclical changes in GDP
- Stagflation
- Late 70s-81: inflation+unemployment increased at same time
- New Phillips approach
- New range- SRPC canmove outward, inward
- Cost push inflation- more stress on resources, wage, input cost
- Supply Shocks- Rapid loss of resources or increase in resource cost
- SRPC moves otuward during shocks
- Inward as society increases productivity or regains resources
- LRPC (Video going over Phillips curve and the effects of inflation and unemployment)
- Inflation- Society adjusts for ost/wage increase with new prices
- Is- Efficient PPF
- Natural rate of unemployment= Full employment
- No trade off between inflation & unemployment
- Economy produces at full employment output level
- Represented by vertical line
- Occurs at Natural rate of unemployment
- Shifts in LRAS also shift LRPC
- Major LRPC Assumption: more worker benefits create higher natural rates; fewer worker benefits create lower natural rates
- Phillips and AD/AS curves-
- Change pts on SRPC- if ad changes move along curve
- Move the SRPC- If SRAS changes, shift SRPC
- Misery Index
- Combination of inflation and unemployment in any given year
- Single Digit Misery is good
Unit 5; Day 1
Aggregate Supply

- Shor Run Aggregate Supply
- In Macroeconomics, this is the period in which wages and other input prices remain fixed as price levels increase or decrease
- Long Run Aggregate supply
- Period of time in which wages have become fully responsive to changes in price level
- Effects over Short-Run
- In the short run, price level changes allow for companies to exceed normal outputs and hire more workers because profits are increasing while wages remain constant
- In long run, wages will adjust to price level and previous output levels will adjust accordingly
- Equilibrium in Extended Model
- The long as curve is represented with vertical line @ full employment level of real GDP
- Demand Pull inflation in the AS model
- Demand- Pull: PRices increase based on increase in AD
- In short run, demand pull will drive up prices, increase production
- In long run, increase in AD will eventually return to previous levels
- Cost Push and Extended model
- Cost push arises from factors that will increase per unit costs such as increase in price of key resource
- Short run shifts left, in this case it is the cause of price level increase, not effect
- Dilemma for the Govt
- In effort to fight cost push, the gov can react in 2 diff ways
- Action such as spending by gov could begin inflationary spiral
- No action could lead to recession by keeping production and employment levels declining
Monday, April 4, 2016
Unit 4; Day 4 Notes
Three Tools of Monetary Policy
Reserve requirement-
If there is a recession, what should FED do to the reserve requirement?
Decrease reserve ratio
Banks hold less $, more ER
Banks create money by loaning out ER
Money supply increases, interest fall, AD ^
If there is inflation, what should FED do to RR?
Increase RR
Banks hold $, less ER
Banks create less money
MS decreases, Interest up, AD down
The Discount Rate-
Interest rate that the FED charges commercial banks
Ex. If bank needs 10 mil, the borrow from US treasury(FED controls) but they must pay back with interest
To increase MS, FED decreases Discount rate(Easy money policy)
To Decrease MS, FED increases discount rate(Tight money policy)
Open Market Operations(OMO)-
FED buys/sells govt bonds(securities)
Most important and widely used monetary policy
To increase MS, FED buys Govt securities
To decrease MS, FED sells govt securities
Federal Funds Rate-
FDIC member banks loan each other overnight funds instead of FED.
Prime Rate-
Interest rates banks give to their most creditworthy customers
Reserve requirement-
- Only small % of bank deposit is safe. Rest is loaned out. “Fractional Reserve Banking”
- FED sets amount that banks must hold
- The reserve ratio is % of the deposits banks must hold
- When FED increases money supply, it increases money held in bank deposits
If there is a recession, what should FED do to the reserve requirement?
Decrease reserve ratio
Banks hold less $, more ER
Banks create money by loaning out ER
Money supply increases, interest fall, AD ^
If there is inflation, what should FED do to RR?
Increase RR
Banks hold $, less ER
Banks create less money
MS decreases, Interest up, AD down
The Discount Rate-
Interest rate that the FED charges commercial banks
Ex. If bank needs 10 mil, the borrow from US treasury(FED controls) but they must pay back with interest
To increase MS, FED decreases Discount rate(Easy money policy)
To Decrease MS, FED increases discount rate(Tight money policy)
Open Market Operations(OMO)-
FED buys/sells govt bonds(securities)
Most important and widely used monetary policy
To increase MS, FED buys Govt securities
To decrease MS, FED sells govt securities
Federal Funds Rate-
FDIC member banks loan each other overnight funds instead of FED.
Prime Rate-
Interest rates banks give to their most creditworthy customers
Unit 4; Day 3 Notes
Banks-
A bank is a financial intermediary
Uses liquid assets( bank deposits) to finance the investments of borrowers.
AKA Fractional reserve banking
a System in which depository institutions hold liquid assets less than the amount of deposits.
Can take the form of:
Currency in bank vaults
Bank reserves- deposits held at the federal reserve
T-Account (Balance sheet)
Statements of assets and liabilities
Assets (amount owned)
Items which a bank holds legal claim
The uses of funds by financial intermediaries
Liabilities (amounts owed)
Legal claims against a bank
Sources of funds for financial intermediaries
Federal Reserve(FED)
7 members appointed by president; terms are staggered
Functions-
Ctrl money supply
Issue paper currency
Set reserve requirements; holds reserves of banks
Lend money to banks; charge interest
Check clearing service for banks
Acts a personal bank for government
Supervises member banks
Reserve Requirements-
Fed requires banks to have some money readily avail for consumer.
Amount set by fed is Required Reserve Ratio (RRR)
RRR- % of demand deposits(checking account balances that must not be loaned out)
Typically 10%
Three types of Multiple deposit expansion Questions
Type 1- Calculate initial change in ER (amount of single bank can loan from initial deposit)
Type 2: Calc. change in loans in banking system
Type 3: Calc. change in money supply
Sometimes type 2 and 3 will have same result(i.e. no fed involvement)
A bank is a financial intermediary
Uses liquid assets( bank deposits) to finance the investments of borrowers.
AKA Fractional reserve banking
a System in which depository institutions hold liquid assets less than the amount of deposits.
Can take the form of:
Currency in bank vaults
Bank reserves- deposits held at the federal reserve
T-Account (Balance sheet)
Statements of assets and liabilities
Assets (amount owned)
Items which a bank holds legal claim
The uses of funds by financial intermediaries
Liabilities (amounts owed)
Legal claims against a bank
Sources of funds for financial intermediaries
Federal Reserve(FED)
7 members appointed by president; terms are staggered
Functions-
Ctrl money supply
Issue paper currency
Set reserve requirements; holds reserves of banks
Lend money to banks; charge interest
Check clearing service for banks
Acts a personal bank for government
Supervises member banks
Reserve Requirements-
Fed requires banks to have some money readily avail for consumer.
Amount set by fed is Required Reserve Ratio (RRR)
RRR- % of demand deposits(checking account balances that must not be loaned out)
Typically 10%
Three types of Multiple deposit expansion Questions
Type 1- Calculate initial change in ER (amount of single bank can loan from initial deposit)
Type 2: Calc. change in loans in banking system
Type 3: Calc. change in money supply
Sometimes type 2 and 3 will have same result(i.e. no fed involvement)
Unit 4; Day 2 Notes
Time Value of Money (3/9)
Is a dollar today worth more than a dollar tomorrow?
YES; Opportunity cost and inflation. This is reason for charging and paying interest.
v = future value of $
p = present value of money
r= Real interest rate(nominal- inflation) expressed as decimal
n= years
k= number of times interest is credited per year
Simple interest rate~ v=(1+r)^n * p
Compound interest rate~ v=(1+ r/k)^nk *p
Money Demand
Demand for money has inverse relationship between nominal interest rates and the quantity of money demanded.
What happens when quantity demanded of money when interest rates rise? demand falls because individuals prefer to have interest earning assets instead of borrowed liabilities.
What happens when interest rates decrease? demand increases, no incentive to convert cash to interest earning assets
3 Things that cause money demand to shift:
change in price level
change in income
Change in taxation that affects investment
Financial Sector
Assets vs. Liabilities- Assets= Owned; Liabilities= Owe
Interest rate- The cost of borrowing money
Stocks vs. Bonds- stocks are risky money, bonds are safe. loan money to gov, gov pays you back.
Is a dollar today worth more than a dollar tomorrow?
YES; Opportunity cost and inflation. This is reason for charging and paying interest.
v = future value of $
p = present value of money
r= Real interest rate(nominal- inflation) expressed as decimal
n= years
k= number of times interest is credited per year
Simple interest rate~ v=(1+r)^n * p
Compound interest rate~ v=(1+ r/k)^nk *p
Money Demand
Demand for money has inverse relationship between nominal interest rates and the quantity of money demanded.
What happens when quantity demanded of money when interest rates rise? demand falls because individuals prefer to have interest earning assets instead of borrowed liabilities.
What happens when interest rates decrease? demand increases, no incentive to convert cash to interest earning assets
3 Things that cause money demand to shift:
change in price level
change in income
Change in taxation that affects investment
Financial Sector
Assets vs. Liabilities- Assets= Owned; Liabilities= Owe
Interest rate- The cost of borrowing money
Stocks vs. Bonds- stocks are risky money, bonds are safe. loan money to gov, gov pays you back.
Unit 4; Day 1 Notes
Money
Uses of money
Medium of exchange- Trade/Barter
Unit of account- Establishes economic worth in exchange process
Store of value- Money holds its value over a period of time whereas products may not
Types of money
Commodity money- Gets its value from the type of material from which it is made. Ex. Silver/Gold coins
Representative money- Paper money backed by something tangible that gives it value. Ex. IOU
Fiat money- Money because the government says so.
Characteristics of money
Durable
Portable
Scarce
Divisible
Acceptable
Uniform
Money Supply
M1 Money-75% of all money, most liquid (easy to convert to cash)
Currency- Coins, cash
Checkable deposits- Demand deposits/Checking accounts
Traveler’s Checks
M2 Money= M1 Money + Savings accounts+ Money Market Accounts + Deposits held by banks outside US.
M3 Money= M2 Money+ Certificates of Deposits(CDs)
increase money supply > Decreases interest rate > Investment increases >AD increases
Decrease money supply > increase interest rate > Investment decreases > AD decreases
Uses of money
Medium of exchange- Trade/Barter
Unit of account- Establishes economic worth in exchange process
Store of value- Money holds its value over a period of time whereas products may not
Types of money
Commodity money- Gets its value from the type of material from which it is made. Ex. Silver/Gold coins
Representative money- Paper money backed by something tangible that gives it value. Ex. IOU
Fiat money- Money because the government says so.
Characteristics of money
Durable
Portable
Scarce
Divisible
Acceptable
Uniform
Money Supply
M1 Money-75% of all money, most liquid (easy to convert to cash)
Currency- Coins, cash
Checkable deposits- Demand deposits/Checking accounts
Traveler’s Checks
M2 Money= M1 Money + Savings accounts+ Money Market Accounts + Deposits held by banks outside US.
M3 Money= M2 Money+ Certificates of Deposits(CDs)
increase money supply > Decreases interest rate > Investment increases >AD increases
Decrease money supply > increase interest rate > Investment decreases > AD decreases
Unit 4: Project Video
Answers/ Rough Outline of Video
A. Federal funds rate- Rate at which banks lend/store money into other banks overnight for those banks to meet their reserve requirement
Goal is to lower Excess Reserves(money left over after holding the required reserves), lower ER= more money being made through loans. These overnight loans are no exception
B. Buying securities as part of an expansionary policy to get more money into the money supply. Since these securities become ER, banks will want to lower the fed funds rate to get rid of excess easier. Selling bonds as part of a tight policy will cause the opposite effect
C. $10 mil= ER * 1/.5=2 monetary mult. = $20 mil. change in loans throughout the banking system, as the ER of 10 mil will become a Direct Deposit of another bank. 20 mil would be the maximum sum of all of these deposits.
D. Nominal interest rate would decrease
E. Real interest decrease due to an increase in inflation but a decrease in nominal interest. Keep in mind Real interest= nominal - inflation, so if nominal goes down but inflation goes up, you are at a net decrease.
Sunday, March 27, 2016
Unit 4, Video 4 Summary
Loan-able funds graphs are easy to draw, interest rates go on the Y-Axis, Quantity goes on the X. There are two lines on the graph, supply of funds which slopes upward and demand for funds which slopes downward and the point they intersect at is the equilibrium. The supply of loan-able funds is dependent on savings. The more money people save, the more money banks have to loan. If the government runs at a deficit, then the demand for money will increase causing the interest rates to go up. The demand will shift to the right or increase. However, the supply of loan-able funds also increase because the supply of money is decreasing. Both can be shown on this graph but only one at a time as they mean roughly the same thing.
Unit 4, Video 6 Summary
It is important to keep all graphs labeled clearly. The three graphs that need to be tied together are the money market graphs, loan-able funds graph and the AD-AS graphs. Changes in the money market affect all of the other graphs. Most of the debt the government owes is to the people, not foreign countries. If the government demand for money increases in our money market graph to work out of a deficit, our interest rates also increase. On our loan-able funds graph, this either decreases our supply of loan-able fund or increases our demand for funds, both mean the same in this case. An increase in government demand causes an increase in AD on the AD-AS graphs which causes the GDP and price level to increase.
Unit 4, Video 5 Summary
The money creation process is how banks actually make money. Money is created by making loans. For example, if the reserve ratio is 20% and the loan amount is $500 is equal to a maximum creation of $2500 dollars in the money supply. This is figured out by multiplying the loan amount by the money multiplier, which is simply 1 over the Reserve ratio. The 2500 makes sense because it is all of the potential loans that could be made if one person withdraws the 500, places 400 into a bank and another withdraws, so on and so forth. This can only happen if there are no excess reserves in these banks. If the banks keep excess reserves, then the grand total of our $2500 is decreased.
Unit 4, Video 3 Summary
This video is over the Tools of Money Policy. There is expansionary which is easy money and contractionary which is tight money. To increase the money supply, reserve ratios(money held by banks) have to go down, along with the discount rate(rate a which banks can borrow money from FED). The opposite must happen to decrease the money supply(contraction). The most common thing banks do for either the creation or depletion of the money supply is buying or selling government bonds, respectively.
Unit 4; Video 2 Summary
Veal is tasty. This video is essentially practice over how to label a money market graph. on the Y-Axis, the price we pay to get money is labeled, AKA interest rate. On the X-Axis is labeled Quantity (of money). Demand will slope down(DM) due to the law of demand. The supply of money(SM) is vertical, because the supply of money is decided by the FED and does not fluctuate. A change in demand for money will shift the demand line either left or right. Changes in money supply will move the vertical line left or right.

Unit 4; Video 1 Summary
On the money market, there are three different types of money. First, there is commodity money which is what has been in use the longest and takes on the many forms such as crops or livestock. Second, there is representative money, which is money that represents something else, such as bills being representative of their equal amount in gold and silver. This kind of money is severely unstable as the worth fluctuates. Thirdly, there is fiat money. This money is not backed by anything except the word of the government, and must be accepted for transaction. Money has three functions as mediums of exchange, store of value and unit of account showing that price has worth(more expensive gives impression of higher quality).
Friday, March 4, 2016
Unit 3; Day 6- Fiscal Policy
Fiscal Policy-Changes in expenditures or tax revenues of the federal government
2 tools of fiscal policy- taxes gov can increase decrease; spending gov can increase decrease
More info. on FP
Fiscal Policy Video
Balanced budget
Revenues= expenditures
Budget deficit
Revenues< expenditures
Budget surplus
Revenues > expenditures
Govt debt= sum of all deficits - sum of all surplus
Government must borrow when in deficit
From individuals, corporations, financial institutions, foreign entities
Discretionary fiscal policy (action)
Expansionary= deficit
Contractionary= surplus
Non-discretionary policy (no action)
Discretionary- increase or decrease gov spending and/or taxes in order to return the economy to full employment. Discretionary policy involves policy makers doing fiscal policy in response to an economic problem
Automatic- unemployment compensation and marginal tax rates are examples of automatic policy that help mitigate the effects of recession and inflation. Automatic fiscal takes place without policy makers having to respond to current economic problems
Expansionary - “easy” combat recession, increase gov spending, lower taxes
Contractionary- “tight” combat Inflation on, lower gov spending, increase taxes
Automatic or built in stabilizers-
Anything that increases gov budget deficit during a recession and increases it's budget surplus during inflation without requiring explicit action by policymakers
Unemployment comp.
Welfare and social security
Medicare medicaid
VA benefits
Progressive tax system
Average tax rate(tax revenue/gdp) rises with gdp
Proportional tax system
Average tax rate remain constant as gdp changes
Regressive tax system
Average tax rate falls with gdp
2 tools of fiscal policy- taxes gov can increase decrease; spending gov can increase decrease
More info. on FP
Fiscal Policy Video
Balanced budget
Revenues= expenditures
Budget deficit
Revenues< expenditures
Budget surplus
Revenues > expenditures
Govt debt= sum of all deficits - sum of all surplus
Government must borrow when in deficit
From individuals, corporations, financial institutions, foreign entities
Discretionary fiscal policy (action)
Expansionary= deficit
Contractionary= surplus
Non-discretionary policy (no action)
Discretionary- increase or decrease gov spending and/or taxes in order to return the economy to full employment. Discretionary policy involves policy makers doing fiscal policy in response to an economic problem
Automatic- unemployment compensation and marginal tax rates are examples of automatic policy that help mitigate the effects of recession and inflation. Automatic fiscal takes place without policy makers having to respond to current economic problems
Expansionary - “easy” combat recession, increase gov spending, lower taxes
Contractionary- “tight” combat Inflation on, lower gov spending, increase taxes
Automatic or built in stabilizers-
Anything that increases gov budget deficit during a recession and increases it's budget surplus during inflation without requiring explicit action by policymakers
Unemployment comp.
Welfare and social security
Medicare medicaid
VA benefits
Progressive tax system
Average tax rate(tax revenue/gdp) rises with gdp
Proportional tax system
Average tax rate remain constant as gdp changes
Regressive tax system
Average tax rate falls with gdp
Unit 3; Day 5- Consumption Spending and Saving
Disposable Income - Income after taxes or net income
DI= Gross income- Taxes
2 Choices
Consume(spend on goods and services)-
Household spending
The ability to consume constrained by- amount of DI, Propensity to save
Do households consume if DI=0? Autonomous Consumption
Save(Not spend on goods and services)-
Household NOT spending
Ability to save is constrained by- amount of DO, Propensity to consume
Do households save if DI=0? No
APC & APS
Consumption/DI= APC
APC + APS=1
1-APC= APS
1-APS=APC
APC>1~ Dissaving
Negative APS~ dissaving
Marginal Propensity to Consume (MPC)- Fraction of any change in DI that is consumed
=Δconsumption/ Δ DI
Marginal Propensity to Save (MPS)- Fraction of Change in DI that is saved
=Δ savings/ Δ DI
MPC+MPS=1
1-MPS= MPC
1-MPC=MPS (People can only consume or save Disposable income)
Tax Multiplier= -MPC/MPS
Govt Spending Multiplier= 1/MPS
The Spending multiplier Effect- An initial change in spending( C,Ig, G, Xn) causes a larger change in Aggregate spending(AS), or Aggregate Demand(AD)
Multiplier= Δ AD/ Δ spending
Calculating the Spending Multiplier- can be calc. from the MPC or MPS
Multiplier= 1/(1-MPC) or 1/MPS
Positive when there is increase in spending, negative when decrease
Calculating the Tax Multiplier- When Govt. taxes, multiplier works reverse. Why? Money is now leaving circular flow.
Tax multiplier(it is negative)= -MPC/(1-MPC) or -MPC/MPS
If there is a tax cut, multiplier is negative; more money in circular flow
DI= Gross income- Taxes
2 Choices
Consume(spend on goods and services)-
Household spending
The ability to consume constrained by- amount of DI, Propensity to save
Do households consume if DI=0? Autonomous Consumption
Save(Not spend on goods and services)-
Household NOT spending
Ability to save is constrained by- amount of DO, Propensity to consume
Do households save if DI=0? No
APC & APS
Consumption/DI= APC
APC + APS=1
1-APC= APS
1-APS=APC
APC>1~ Dissaving
Negative APS~ dissaving
Marginal Propensity to Consume (MPC)- Fraction of any change in DI that is consumed
=Δconsumption/ Δ DI
Marginal Propensity to Save (MPS)- Fraction of Change in DI that is saved
=Δ savings/ Δ DI
MPC+MPS=1
1-MPS= MPC
1-MPC=MPS (People can only consume or save Disposable income)
Tax Multiplier= -MPC/MPS
Govt Spending Multiplier= 1/MPS
The Spending multiplier Effect- An initial change in spending( C,Ig, G, Xn) causes a larger change in Aggregate spending(AS), or Aggregate Demand(AD)
Multiplier= Δ AD/ Δ spending
Calculating the Spending Multiplier- can be calc. from the MPC or MPS
Multiplier= 1/(1-MPC) or 1/MPS
Positive when there is increase in spending, negative when decrease
Calculating the Tax Multiplier- When Govt. taxes, multiplier works reverse. Why? Money is now leaving circular flow.
Tax multiplier(it is negative)= -MPC/(1-MPC) or -MPC/MPS
If there is a tax cut, multiplier is negative; more money in circular flow
Unit 3; Day 4- Classical Vs. Keynesian
Video on Classical vs. Keynesian
Classical School-
Modern Followers- Adam Smith, Alfred Marshall, JB Say, David Ricardo
Say's Law- Supply always creates its own demand.
Production=income=spending; under spending is unlikely
Whatever output produced will be demanded.
Savings= Investment income, Saving(leakage)= Investment(Injection)
Competition good
Government-
Invisible Hand- Govt/econ. can regulate self
Monetary rule
maintains steady money supply
Laissez-Faire
Economy-
Economy self regulating
In long run, economy will balance at full employment.
Economy is always close to or full employment
Unemployment rarely exists due to wage, price flexibility
Prices, wages are flexible downward
Support trickle-down effect (rich first, everyone else second)
Supply curve- Vertical
AS determines output, employment
AD determines price level, reasonably stable if money supply is stable.
MV=P*Q
SRAS is short, Emphasis today in Microeconomics
Keynesian School-
Competition flawed
AD is key, not AS
Leaks and savings cause recession
Government
Fiscal Policy- Tax and spend
Believe in active government
Economy is no self-regulating
Economy
C+Ig+G+Xn=GDP
AD determines output and employment
Ratchet effects+ Sticky wages block Say’s Law.
Prices and wages inflexible downward
Unemployment usually exists, caused by external and internal
Inflation is caused by too much demand
SRAS is long, Emphasis today in macroecnomics. In long run, we are dead.
Classical School-
Modern Followers- Adam Smith, Alfred Marshall, JB Say, David Ricardo
Say's Law- Supply always creates its own demand.
Production=income=spending; under spending is unlikely
Whatever output produced will be demanded.
Savings= Investment income, Saving(leakage)= Investment(Injection)
Competition good
Government-
Invisible Hand- Govt/econ. can regulate self
Monetary rule
maintains steady money supply
Laissez-Faire
Economy-
Economy self regulating
In long run, economy will balance at full employment.
Economy is always close to or full employment
Unemployment rarely exists due to wage, price flexibility
Prices, wages are flexible downward
Support trickle-down effect (rich first, everyone else second)
Supply curve- Vertical
AS determines output, employment
AD determines price level, reasonably stable if money supply is stable.
MV=P*Q
SRAS is short, Emphasis today in Microeconomics
Keynesian School-
Competition flawed
AD is key, not AS
Leaks and savings cause recession
Government
Fiscal Policy- Tax and spend
Believe in active government
Economy is no self-regulating
Economy
C+Ig+G+Xn=GDP
AD determines output and employment
Ratchet effects+ Sticky wages block Say’s Law.
Prices and wages inflexible downward
Unemployment usually exists, caused by external and internal
Inflation is caused by too much demand
SRAS is long, Emphasis today in macroecnomics. In long run, we are dead.
Unit 3; Day 3- Investment
Investment- money spent or expenditures on:
New plants(factory)
Capital Equipment(Machinery)
Technology(hardware/software)
New Homes
Inventories(goods sold by producers)
Expected Rates of Return-
How does business make investment decisions? Cost/ Benefit Analysis
How does a business determine benefit? Expected rate of return
How does business count cost? Interest Costs
How does business determine the amount of investment they undertake? Compare expected rate of return to interest cost.
If expected return> interest cost, then invest
If expected return< interest cost, do not invest
Real(r%) vs. Nominal(i%)
What’s the difference?
Nominal is the observable rate of interest.
Real subtracts out inflation(pi%) and is only known ex post facto.
How do you compute the real interest rate(r%)?
r%-i%-pi%
What then, determines the cost of an investment decision?
The real interest rate(r%)
~
Investment demand curve- Downward sloping.
Why? When interest rates are high, fewer investments are profitable; when interest rates are low, more investments are profitable.
Shifts in Investment Demand
Cost of production
Lower costs shift ID>
Higher costs shift ID<
Business taxes
Lower taxes ID>
Higher taxes ID<
Technological Change
New tech ID>
Lack of tech ID<
Stock of Capital
Low capital ID>
High Capital ID<
Expectations
Positive expect. ID>
Negative Expect ID<
New plants(factory)
Capital Equipment(Machinery)
Technology(hardware/software)
New Homes
Inventories(goods sold by producers)
Expected Rates of Return-
How does business make investment decisions? Cost/ Benefit Analysis
How does a business determine benefit? Expected rate of return
How does business count cost? Interest Costs
How does business determine the amount of investment they undertake? Compare expected rate of return to interest cost.
If expected return> interest cost, then invest
If expected return< interest cost, do not invest
Real(r%) vs. Nominal(i%)
What’s the difference?
Nominal is the observable rate of interest.
Real subtracts out inflation(pi%) and is only known ex post facto.
How do you compute the real interest rate(r%)?
r%-i%-pi%
What then, determines the cost of an investment decision?
The real interest rate(r%)
~
Investment demand curve- Downward sloping.
Why? When interest rates are high, fewer investments are profitable; when interest rates are low, more investments are profitable.
Shifts in Investment Demand
Cost of production
Lower costs shift ID>
Higher costs shift ID<
Business taxes
Lower taxes ID>
Higher taxes ID<
Technological Change
New tech ID>
Lack of tech ID<
Stock of Capital
Low capital ID>
High Capital ID<
Expectations
Positive expect. ID>
Negative Expect ID<
Unit 3; Day 2- Aggregate Supply
Aggregate Supply- Level of Real GDP that firms produce at price level

Long-Run- Period of time where input prices are completely flexible; adjust to changes in price level. Level of real gdp supplied is independent price level.
Short-Run- Period of time where input prices are sticky; do not adjust to changes in price level. Level of real gdp supplied directly related to price level
Long Run Aggregate Supply(LRAS)- marks level of full employment in economy (analogous to PPC)
Because input prices are completely flexible, changes in price level do not change firms’ real profits and therefore do not change firms’ level of output. This means that LRAS is vertical at economy’s lvl of employment.
Short Run Aggregate Supply(SRAS)- increase in SRAS= shift to right. ->; Decrease in SRAS is seen as shift to the left. SRAS<-
Key unit to understanding shifts is per unit cost of produc. = total input cost (input*price per unit)/ total output

Things that affect SRAS
Input Prices-
Domestic resource prices-
Wages(75% business costs)
cost ofcapital
raw materials(commodity prices)
Foreign resource prices-
Strong$= lower foreign resources prices
Weak$= Higher foreign resource prices
Market power
Increases in resource prices= SRAS<-
Decrease in resource prices= SRAS->
Productivity= Total output/ total input
More productivity= lower unit produc. cost= SRAS>
Lower productivity= higher unit produc. cost= SRAS<
Taxes and Subsidies
Taxes($ to govt) on business increase per unit produc. cost= SRAS<
Subsidies($ from gov) to business reduce produc. cost= SRAS>
Government regulation
Govt regulation creates cost compliance= SRAS<
Deregulation reduces compliance costs= SRAS>
~
Full Employment
Equilibrium exists where AD intersects SRAS and LRAS at same point.
Recessionary Gap
Exists when equilibrium occurs below full employment output.
Inflationary Gap
Exists when equilibrium occurs beyond full employment output
~
Nominal wages- Amount of money received by a worker per unit of Time
Real Wage- amount of goods and services a worker can purchase with their nominal wages. In essence, real wage is the purchasing power of nominal
Sticky wage- Amount set based on initial price level and does not vary due to labor contracts or other restrictions.
Long-Run- Period of time where input prices are completely flexible; adjust to changes in price level. Level of real gdp supplied is independent price level.
Short-Run- Period of time where input prices are sticky; do not adjust to changes in price level. Level of real gdp supplied directly related to price level
Long Run Aggregate Supply(LRAS)- marks level of full employment in economy (analogous to PPC)
Because input prices are completely flexible, changes in price level do not change firms’ real profits and therefore do not change firms’ level of output. This means that LRAS is vertical at economy’s lvl of employment.
Short Run Aggregate Supply(SRAS)- increase in SRAS= shift to right. ->; Decrease in SRAS is seen as shift to the left. SRAS<-
Key unit to understanding shifts is per unit cost of produc. = total input cost (input*price per unit)/ total output
Things that affect SRAS
Input Prices-
Domestic resource prices-
Wages(75% business costs)
cost ofcapital
raw materials(commodity prices)
Foreign resource prices-
Strong$= lower foreign resources prices
Weak$= Higher foreign resource prices
Market power
Increases in resource prices= SRAS<-
Decrease in resource prices= SRAS->
Productivity= Total output/ total input
More productivity= lower unit produc. cost= SRAS>
Lower productivity= higher unit produc. cost= SRAS<
Taxes and Subsidies
Taxes($ to govt) on business increase per unit produc. cost= SRAS<
Subsidies($ from gov) to business reduce produc. cost= SRAS>
Government regulation
Govt regulation creates cost compliance= SRAS<
Deregulation reduces compliance costs= SRAS>
~
Full Employment
Equilibrium exists where AD intersects SRAS and LRAS at same point.
Recessionary Gap
Exists when equilibrium occurs below full employment output.
Inflationary Gap
Exists when equilibrium occurs beyond full employment output
~
Nominal wages- Amount of money received by a worker per unit of Time
Real Wage- amount of goods and services a worker can purchase with their nominal wages. In essence, real wage is the purchasing power of nominal
Sticky wage- Amount set based on initial price level and does not vary due to labor contracts or other restrictions.
Unit 3; Day 1- Aggregate Demand
Aggregate Demand Curve =C+I+G+Xn
Price lvl = Y, Real GDP= X; There is an inverse relationship between X and Y.

AD is the demand by consumers, businesses, government, and foreign countries.
What definitely doesn’t shift the curve?
Changes in price level cause a move along the curve.
Why is AD downward sloping?
1. Real balance effect-
Higher price levels reduce the purchasing power of money
This decreases the quantity of expenditures
Lower price levels increase purchasing power and increase and expenditures
2. Interest Rate effect-
When the price level increases, lenders need to charge higher interest rates to get a REAL return on their loans.
Higher interest rates discourage consumer spending and business investment.
3. Foreign Trade Effect
When US price level rises, foreign buyers purchase fewer US goods and Americans buy more foreign goods.
Exports fall and imports rise, causing real GDP to fall. (Xn decreases)
Shifters of aggregate Demand: GDP= C+I+G+Xn
There are two parts to a shift in AD
A change in C, I, G, and/or Xn
A multiplier effect that produces a greater change than original change in 4 components
Increase in AD= AD->
Decrease in AD= <-AD
Determinants of AD-
Consumption
Household spending is affected by:
Consumer wealth. More wealth= more spending(AD ->), less wealth= less spending
Consumer Expectations. Positive expectations= more spending, Neg.= less spending
Household indebtedness. Less debt= more spending, more debt= less spending
Taxes. Less taxes, more spending, more taxes, less spending
Gross Private Domestic Investment
Investment spending is sensitive to:
Real Interest rate. Lower rate= more investment(AD->); higher Real interest rate= Less investment
Expected returns. Higher expected returns= More investment, Lower Expected returns= less investment
Influenced by-
Expectations of future profitability,
Tech
Degree of excess capacity(Existing stock of capital)
Business taxes
Net Exports
Sensitive to
Exchange rates. Strong $= more imports. less exports. (AD<). Weak$= Fewer imports, more exports (AD>)
Relative income. Strong foreign economies= more exports (AD>). Weak foreign economies= less imports (AD<)
Price lvl = Y, Real GDP= X; There is an inverse relationship between X and Y.
AD is the demand by consumers, businesses, government, and foreign countries.
What definitely doesn’t shift the curve?
Changes in price level cause a move along the curve.
Why is AD downward sloping?
1. Real balance effect-
Higher price levels reduce the purchasing power of money
This decreases the quantity of expenditures
Lower price levels increase purchasing power and increase and expenditures
2. Interest Rate effect-
When the price level increases, lenders need to charge higher interest rates to get a REAL return on their loans.
Higher interest rates discourage consumer spending and business investment.
3. Foreign Trade Effect
When US price level rises, foreign buyers purchase fewer US goods and Americans buy more foreign goods.
Exports fall and imports rise, causing real GDP to fall. (Xn decreases)
Shifters of aggregate Demand: GDP= C+I+G+Xn
There are two parts to a shift in AD
A change in C, I, G, and/or Xn
A multiplier effect that produces a greater change than original change in 4 components
Increase in AD= AD->
Decrease in AD= <-AD
Determinants of AD-
Consumption
Household spending is affected by:
Consumer wealth. More wealth= more spending(AD ->), less wealth= less spending
Consumer Expectations. Positive expectations= more spending, Neg.= less spending
Household indebtedness. Less debt= more spending, more debt= less spending
Taxes. Less taxes, more spending, more taxes, less spending
Gross Private Domestic Investment
Investment spending is sensitive to:
Real Interest rate. Lower rate= more investment(AD->); higher Real interest rate= Less investment
Expected returns. Higher expected returns= More investment, Lower Expected returns= less investment
Influenced by-
Expectations of future profitability,
Tech
Degree of excess capacity(Existing stock of capital)
Business taxes
Net Exports
Sensitive to
Exchange rates. Strong $= more imports. less exports. (AD<). Weak$= Fewer imports, more exports (AD>)
Relative income. Strong foreign economies= more exports (AD>). Weak foreign economies= less imports (AD<)
Wednesday, February 10, 2016
Unit 2; Day 5
Unemployment- Failure to use available resources, particularly labor, to produce desired goods and services
Labor Force-
Employed+Unemployed
Above 16 yrs
Able, Willing to work
Not in Labor Force-
Military
Students
Retired
Disabled
Homemakers
Mental Institutions
Jail/Prison
Those who are not looking for a job
Unemployment rate- 4-5%= Full Employment/ Natural Rate of unemployment (NRU)
(# Unemployed)/ ((Employed) +(# Unemployed) ) x100
Unemployment Types
Frictional Unemployment- Searching for a job/ Temporarily unemployed/ In between jobs. Have transferable skills eg. Better opportunity or graduate
Structural- Changes in structure of labor force which makes some skills/jobs obsolete. Do not have transferable skills
Seasonal- Depends on time of near, nature of job. eg. school bus drivers, life guards
Cyclical- Results from economic downturns such as a recession. As demands for goods fall, demand for labor also falls and workers are laid off.
Frictional+Structural= NRU
Full Employment means there is no cyclical unemployment
GDP gap -amount of which actual gdp falls short of potential gdp
Okun's law- for every one percent in which actual unemployment rate exceeds the NRU, a GDP gap of about 2 percent exists
ex. In 2012, the unemployment rate was 7.6 percent. The NRU was 6 percent.
Rule of 70- is used to determine how many years it takes for a value to double given a particular growth rate.
ex. If 20,000 in bank, and it earns yearly interest of 7 percent how many years will it take for income to double? 70/ 7 = 10 years.
Labor Force-
Employed+Unemployed
Above 16 yrs
Able, Willing to work
Not in Labor Force-
Military
Students
Retired
Disabled
Homemakers
Mental Institutions
Jail/Prison
Those who are not looking for a job
Unemployment rate- 4-5%= Full Employment/ Natural Rate of unemployment (NRU)
(# Unemployed)/ ((Employed) +(# Unemployed) ) x100
Unemployment Types
Frictional Unemployment- Searching for a job/ Temporarily unemployed/ In between jobs. Have transferable skills eg. Better opportunity or graduate
Structural- Changes in structure of labor force which makes some skills/jobs obsolete. Do not have transferable skills
Seasonal- Depends on time of near, nature of job. eg. school bus drivers, life guards
Cyclical- Results from economic downturns such as a recession. As demands for goods fall, demand for labor also falls and workers are laid off.
Frictional+Structural= NRU
Full Employment means there is no cyclical unemployment
GDP gap -amount of which actual gdp falls short of potential gdp
Okun's law- for every one percent in which actual unemployment rate exceeds the NRU, a GDP gap of about 2 percent exists
ex. In 2012, the unemployment rate was 7.6 percent. The NRU was 6 percent.
Rule of 70- is used to determine how many years it takes for a value to double given a particular growth rate.
ex. If 20,000 in bank, and it earns yearly interest of 7 percent how many years will it take for income to double? 70/ 7 = 10 years.
Unit 2; Day 4
Inflation= (Price index in yr 2 - price index yr 1)/ price index in yr 1 *100
What is Inflation? Video
Nominal Interest Rate- % increase in money the borrower must pay the lender for a loan. Not adjusted for inflation. =(Expected Interest Rate + Inflation Premium)
>Anticipated Inflation
>Fisher Effect
Real Interest Rate- % increase in purchasing power the bower must pay the lender for a loan. Adjusted for inflation. =(Nominal Interest rate- Inflation)
Hurt By inflation
Savers
Creditors/ Lenders
Those on a fixed income( Elderly, Welfare, Medicare, Medicaid, Social Security)
Helped By Inflation
Debtors
COLA- Cost of living Adjustment. Gives automatic wage increases when inflation occurs. Cali+NY get adjustment due standard of living.
Video:
What is Inflation? Video
Nominal Interest Rate- % increase in money the borrower must pay the lender for a loan. Not adjusted for inflation. =(Expected Interest Rate + Inflation Premium)
>Anticipated Inflation
>Fisher Effect
Real Interest Rate- % increase in purchasing power the bower must pay the lender for a loan. Adjusted for inflation. =(Nominal Interest rate- Inflation)
Hurt By inflation
Savers
Creditors/ Lenders
Those on a fixed income( Elderly, Welfare, Medicare, Medicaid, Social Security)
Helped By Inflation
Debtors
COLA- Cost of living Adjustment. Gives automatic wage increases when inflation occurs. Cali+NY get adjustment due standard of living.
Video:
Unit 2, Day 3
Nominal GDP- Value of output produced in current prices. Can increase from yr to yr if either output or prices increase Total Q*P
Real GDP- Value of output produces in constant or base year prices. Adjusted for inflation. Can increase year to year only if output increases. P*Q= Real GDP. If we want to measure economic growth, we will use Real GDP.
If we want to measure increase in prices(inflation) we will use nominal GDP
Real GDP- Value of output produces in constant or base year prices. Adjusted for inflation. Can increase year to year only if output increases. P*Q= Real GDP. If we want to measure economic growth, we will use Real GDP.
If we want to measure increase in prices(inflation) we will use nominal GDP
Quantity in 2015
|
Quantity in 2016
|
Price in 2015
|
Price in 2016
| |
Pizzas
|
5
|
6
|
$10
|
$15
|
CD
|
4
|
5
|
$15
|
$20
|
Stereo
|
2
|
4
|
$610
|
$550
|
Automobile
|
1
|
1
|
$10,000
|
$12,000
|
Nominal GDP: 5*10=50
4*15=60
2*610=1220
1*10,000= 10,000 Total= 11,310 = Nominal GDP in 2015= Real GDP 2015
Nominal GDP 2016: 14,390
Real GDP 2016= Quantity 2016* Price 2015= 12,535
GDP Deflator- Price index used to adjust from nominal to real. (Nominal GDP/Real GDP) *100
In the base year, the GDP deflator will always equal 100. For years after the base year, the GDP deflator is greater than 100. Years before base year, GDP is less than 100.
Consumer Price Index(CPI)- Most commonly used measurement for inflation. Measures the cost of a market basket of goods for a typical urban american family.
(Cost of a market basket of goods in a given yr)/ (cost of market basket of goods in base year) * 100
Unit 2, Day 3
Ways to Calculate GDP-
Expenditure Approach- Add up all spending on final goods/Services produced in given yr.
C+Ig+G+Xn
Income Approach- Add up all income that resulted from selling all final goods and services provided in a given year.
GDP=W+R+I+P+Statistical Adjustments
Statistical Adjustments- Indirect business taxes, depreciation(Consumption of fixed capital), Net foreign factor payment

National Income- Add All
Compensation of Employees- include wages salaries, fringe benefits, social security contrib., health, pension plans
Rents- Income of property owners
Interest- Income that is paid by someone to the owner of a loan
Corporate Profits- Income of stockholders in a corporation
Proprietor's Income- income of sole proprietor or partnership
Or GDP-Indirect Business Taxes-Depreciation- Net foreign Factor
Budget Surplus/Deficit- Govt purchases+ Transfer payments -Gov tax fee collection.
If positive= Deficit; If negative, Surplus
Trade Surplus- Exports- Imports
Positive= Surplus, Negative= Deficit
Disposable Personal Income-
National income- Personal Household Taxes+ Government Transfer Payments
Net Domestic Product(NDP)= GDP-Depreciation
Net National Product(NNP)= GNP- Depreciation
GNP=GDP+Net foreign factor payment
Expenditure Approach- Add up all spending on final goods/Services produced in given yr.
C+Ig+G+Xn
Income Approach- Add up all income that resulted from selling all final goods and services provided in a given year.
GDP=W+R+I+P+Statistical Adjustments
Statistical Adjustments- Indirect business taxes, depreciation(Consumption of fixed capital), Net foreign factor payment
National Income- Add All
Compensation of Employees- include wages salaries, fringe benefits, social security contrib., health, pension plans
Rents- Income of property owners
Interest- Income that is paid by someone to the owner of a loan
Corporate Profits- Income of stockholders in a corporation
Proprietor's Income- income of sole proprietor or partnership
Or GDP-Indirect Business Taxes-Depreciation- Net foreign Factor
Budget Surplus/Deficit- Govt purchases+ Transfer payments -Gov tax fee collection.
If positive= Deficit; If negative, Surplus
Trade Surplus- Exports- Imports
Positive= Surplus, Negative= Deficit
Disposable Personal Income-
National income- Personal Household Taxes+ Government Transfer Payments
Net Domestic Product(NDP)= GDP-Depreciation
Net National Product(NNP)= GNP- Depreciation
GNP=GDP+Net foreign factor payment
Unit 2; Day 2
GDP- the market value of all final goods and services produced within a ration in a given year
What’s not included in GDP-
Intermediate goods-a good that required further processing before purchase
Used or handmade goods
purely financial transactions(stocks and goods)
Unreported business activity
Illegal activity
Nonmarket activity eg. Volunteering, babysitting, anything you perform for yourself, producing your own source of labor,
Transfer payments: Public(Social security, VA, welfare) + Private(Scholarships)
International GNP
What’s included in GDP-
C- 65% Personal Consumption Expenditures, wages
IG- 17% Gross private domestic Investment: New fact. equip., Fact. equip. maint., construction of housing, unsold inventory of products build in a year
G- 20% Government Spending
Xn- -2% Net Exports (Exports- Imports)
What’s not included in GDP-
Intermediate goods-a good that required further processing before purchase
Used or handmade goods
purely financial transactions(stocks and goods)
Unreported business activity
Illegal activity
Nonmarket activity eg. Volunteering, babysitting, anything you perform for yourself, producing your own source of labor,
Transfer payments: Public(Social security, VA, welfare) + Private(Scholarships)
International GNP
What’s included in GDP-
C- 65% Personal Consumption Expenditures, wages
IG- 17% Gross private domestic Investment: New fact. equip., Fact. equip. maint., construction of housing, unsold inventory of products build in a year
G- 20% Government Spending
Xn- -2% Net Exports (Exports- Imports)
Unit 2; Day 1
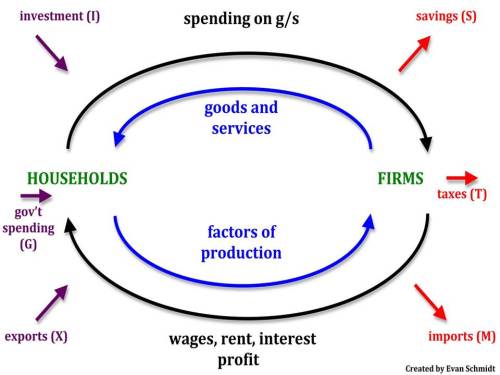
Circular Flow diagram- reps transactions in an economy
Product Market- Place where goods and services are produced by businesses
Factor market- place where households sell resources and businesses buy resources. Firms purchase/rent land and hire workers
Firms-organization that produces goods and services for sale
Household- Person/group that share income
WRIP- Wages, Rent, Interest, Profit

Product Market- Place where goods and services are produced by businesses
Factor market- place where households sell resources and businesses buy resources. Firms purchase/rent land and hire workers
Firms-organization that produces goods and services for sale
Household- Person/group that share income
WRIP- Wages, Rent, Interest, Profit
Monday, January 25, 2016
Unit 1; Day 6
Peak- Highest point of real GDP; phase exibits lowest unemployment, greatest amount of spending. Inflation becomes problem
Expansion- AKA recovery; Real GDP Increasing due to increase in spending, decrease in unemployment
Contraction/ Recession- Real GDP declining for 6 months due to reduc. in spending, increase in unemployment
Trough- Lowest point of real GDP; exibits highest amount of unemployment, least amount of spending
Ex.
Expansion- AKA recovery; Real GDP Increasing due to increase in spending, decrease in unemployment
Contraction/ Recession- Real GDP declining for 6 months due to reduc. in spending, increase in unemployment
Trough- Lowest point of real GDP; exibits highest amount of unemployment, least amount of spending
Ex.
Unit 1; Day 5
Fixed cost- Cost that does not change eg. rent, mortgage, insurance, salary
Variable Cost- Rises or falls depending on how much is produced eg. electricity summer+winter
Marginal Cost- cost of producing 1 more unit of a good
Total Fixed Cost= TFC; Total Variable Cost= TVC; Total Cost= TC; AFC= Average Fixed Cost; AVC= Average Variable Cost; AVT= Average Total Cost; Q= Quantity.
TFC+TVC= TC
AFC+AVC= ATC
TFC/Q=AFC
TVC/Q=AVC
TC/Q=ATC
TFC=AFC*Q
TVC=AVC*Q
TCn-TCn-1= MC
Variable Cost- Rises or falls depending on how much is produced eg. electricity summer+winter
Marginal Cost- cost of producing 1 more unit of a good
Total Fixed Cost= TFC; Total Variable Cost= TVC; Total Cost= TC; AFC= Average Fixed Cost; AVC= Average Variable Cost; AVT= Average Total Cost; Q= Quantity.
TFC+TVC= TC
AFC+AVC= ATC
TFC/Q=AFC
TVC/Q=AVC
TC/Q=ATC
TFC=AFC*Q
TVC=AVC*Q
TCn-TCn-1= MC
Unit 1; Day 4
Elasticity demand-measures of how consumers react to price
Elastic Demand- very sensitive to change in price, E>1
Product is not a necessity
Avail. substitutes
Inelastic Demand- Not very sensitive to change in price, E<1
Product is a necessity
Few or no substitutes
People will buy no matter what
Unit/Unitary Elastic- E=1
Elastic(Sbs avail)
Soda
Steaks
Inelastic(No Sbs)
Gas
insulin
Price Elasticity of Demand(PED)- 3 step formula
Quantity
(New quantity- Old Quantity) / old quantity
Price
(New price- Old price)/ Old price
PED
(% Change in quantity Demand )/(%change in price)
Total Revenue- Total amount of money that a firm receives from selling goods and services
TR=PxQ
Unit 1; Day 3
Normal good-Increase in income causes increase in demand
Inferior good- increase in income causes fall in demand
Complementary goods- burger and fries
Substitute goods- mustard for ketchup
Supply is quantity producers/ sellers are willing to produce at varying prices.
Law of Supply- Direct relationship between price and quantity supply
Causes of a Change in Supply
Δ Technology
Δ Weather
Δ Cost of Production
Δ # of Sellers
Δ Taxes/ Subsidies(Govt $$)
Δ Expectation

Unit 1; Day 2
What causes the PPC/PPF to shift?
Advances in technology
Change in Resources
Change in labor force
economic growth
Natural disaster/war/famine
More education/training(Human Capital)
5 Determinants that cause a change in demand
Δ Buyer's Taste (ads)
Δ # of Buyers (Population)
Δ Income (Normal vs Inferior Good)
Δ Price of Related goods (Complementary and Substitute)
Δ Expectations
Demand is quantities that people are willing/ able to buy at varying prices
Law of Demand: Inverse relationship between price and quantity demanded
A Demand Curve
Advances in technology
Change in Resources
Change in labor force
economic growth
Natural disaster/war/famine
More education/training(Human Capital)
5 Determinants that cause a change in demand
Δ Buyer's Taste (ads)
Δ # of Buyers (Population)
Δ Income (Normal vs Inferior Good)
Δ Price of Related goods (Complementary and Substitute)
Δ Expectations
Demand is quantities that people are willing/ able to buy at varying prices
Law of Demand: Inverse relationship between price and quantity demanded
A Demand Curve

Sunday, January 24, 2016
Unit 1; Day 1
Macroeconomics- Study of economy as a whole eg. inflation wage laws and internet trade
Microeconomics- study of individual/specific units of economy eg. supply demand, market structure, business orgs.
Positive Economic- Attempt to describe world as as is "What is"
Normative Economics- Attempt to prescribe how world should be "Ought to be"
Needs- Basic requirement for survival eg. food, water, shelter
Wants- Desires of citizens
Goods- Tangible commodities
Capital- Used in creation of other goods (machines)
Consumer- Intended for final use by consumer
Services- Work performed for someone else
Scarcity- Most fundamental problem all societies face. Trying to satisfy unlimited wants w/ limited resources (oil)
Shortage-Quantity demanded is greater than supply
Factors of Production- Land, Labor, Capitol, Entrepreneurship.
Trade Offs- alternatives that we give up whenever we choose one course of action over another
Opportunity Cost- next best alternative
Production Possibility Curve(PPC)- shows alternative way to use community resources
Frontier(PPF)
Graph(PPG)
4 Assumptions of a PPG: Two goods. Fixed resources(land capital, labor, entrepreneurship), fixed tech, full employment of resources
Efficiency- using resources in a way maximizing production
Allocative Efficiency- products being produced are the ones that a society desires
Productive Efficiency- products being produced in least productive way; reps any point on the PPC
Under Utilization- using fewer resources than an economy is capable of using
3 Types of movement that occur within PPG-
Inside PPC- occurs when resources are unemployed or underemployed (Attainable+Inefficient)
Along PPC- moving back and forth on the curve (Attainable+Efficient)
Shifts the PPC- shifting of the curve outward or inward(Unattainable)
Video- Production Possibility Graphs
Video- Production Possibility Graphs

Thursday, January 21, 2016
Subscribe to:
Posts (Atom)